Cyclops-7 Logger Traces Fluorescein in Nepal
March 4, 2019
Measuring Dissolved Oxygen Levels in Seawater
May 21, 2019Comparing the miniDOT Logger to the Seabird
Project Details
- PRODUCT(S): miniDOT® Logger
- APPLICATION: Coastal / Ocean
- PARAMETER: Dissolved Oxygen, Temperature
- LOCATION: San Luis Obispo Bay, California
- ORGANIZATION: California Polytechnic State University
- RECOGNITION: Ryan Walter, Assistant Professor

Case Study Description
Two sensors, the miniDOT logger and the SBE 37 w/ODO were placed in the inlet to San Luis Obispo Bay, California. The following case study summarizes the research and the results of the two different sensors’ measurements in the bay.
Comparison of Two Sensors
The SBE 37 w/ ODO was located 2 meters above the bottom/bed (mab), while the miniDOT sensor was located at 2.33 mab. The sensors remained in these positions for 1.5 months with monthly servicing.
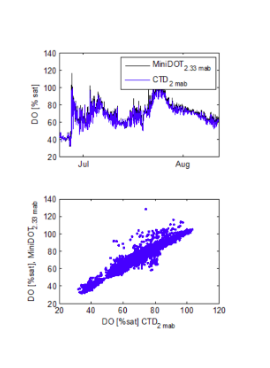
Below are time series plots of the oxygen and DO (mg/L), as well as scatter plots comparing the two.
The upper, time series, plots show that both sensors recorded essentially the same features in both temperature and dissolved oxygen. The lower, scatter, plots show the degree of agreement between the two sensors. Each point on these plots shows the measurement from miniDOT plotted along the Y axis and the measurement from SBE 37, taken at the same time, plotted along the X axis. If these two measurements were exactly equal they would fall on the 1:1 heavy black line shown in the plots. Both T and DO show scatter, and a bias towards larger values for the miniDOT. However, the miniDOT was 0.33 meters higher in the water column in a heavily stratified area.

 The upper, time series, plots show that both sensors recorded essentially the same features in both temperature and dissolved oxygen. The lower, scatter, plots show the degree of agreement between the two sensors. Each point on these plots shows the measurement from miniDOT plotted along the Y axis and the measurement from SBE 37, taken at the same time, plotted along the X axis. If these two measurements were exactly equal they would fall on the 1:1 heavy black line shown in the plots. Both T and DO show scatter, and a bias towards larger values for the miniDOT. However, the miniDOT was 0.33 meters higher in the water column in a heavily stratified area.
Below you can see the calculated % saturation using the depth and an average salinity of 33.5 (based on CTD measurements on that location).
Each sensor received a good amount of biofouling. Both instruments were brand new, thus recently calibrated. The customer observed, “The miniDOT had the copper mesh guard installed and looked good after about a month at which time I dove on the instruments and scrubbed for cleaning. At the end of the experiment the miniDOT still looked good”.
At the end of the experiment, both instruments had comparable biofouling present on the outside and both had the same tape on them covering the plastic housing.
Product Description
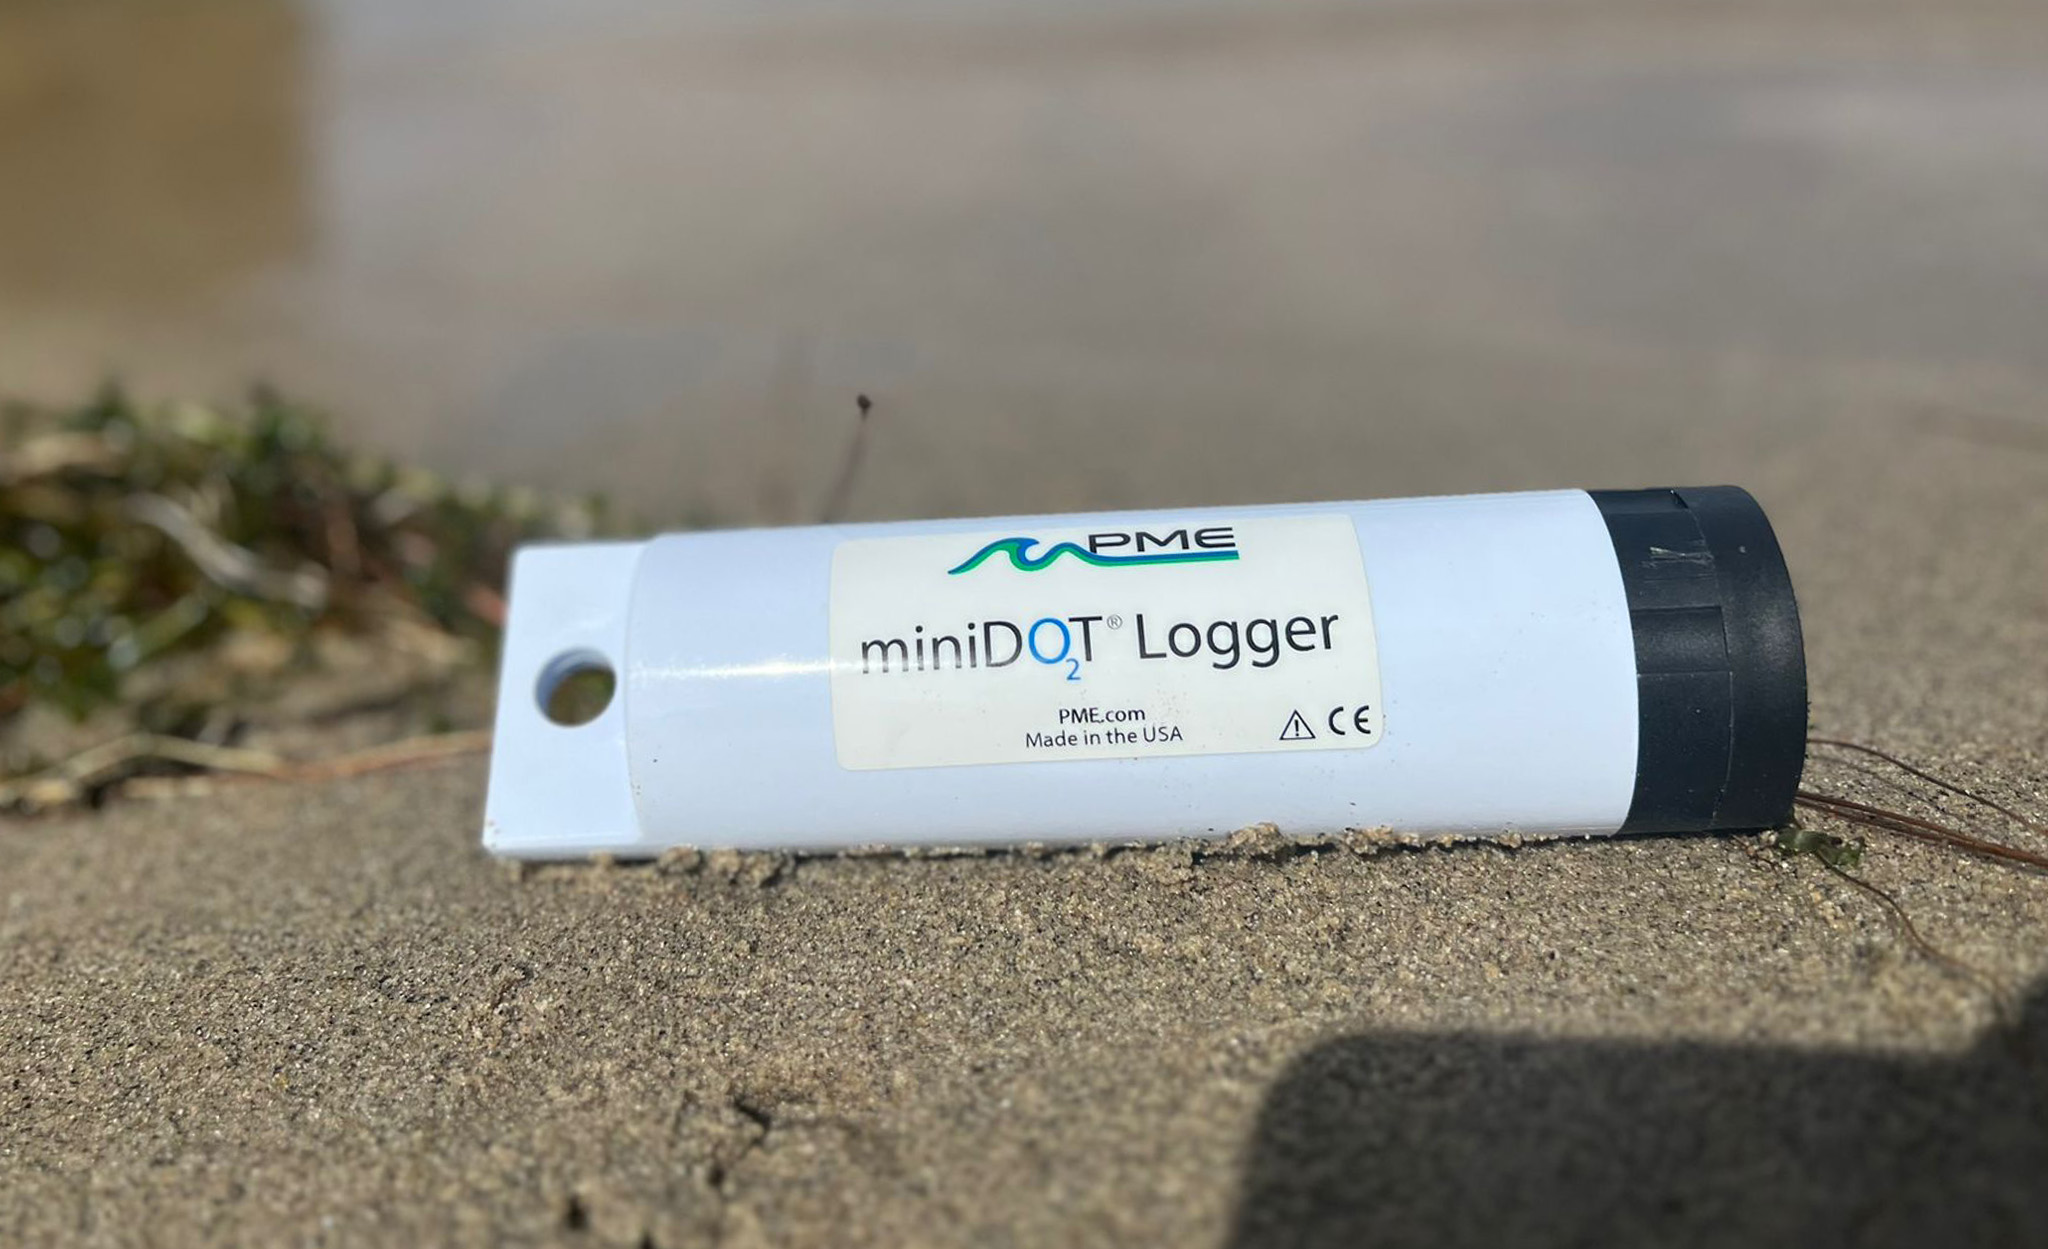
The miniDOT® logger is a completely submersible instrument that logs dissolved oxygen and temperature measurements. The oxygen sensor is an optode that senses dissolved oxygen concentration in water through a fluorescence method. Setting the time and sample interval can be accomplished via a USB cable which are widely available and allow for transparent technology transfer. Measurements are recorded in internal memory at user-selected intervals of between 1 minute up to 24 hours for periods of up to 1 year.
PME Provides High-Performing Monitoring
The miniDOT Logger, while protected from fouling by a simple copper screen, achieved good agreement with the SBE 37 in temperature and dissolved oxygen measurements over 1.5 months deployment in coastal ocean conditions.
As observed by the customer, “PME’s miniDOT logger is much less expensive compared to the Sea Bird and appears to have achieved comparable results.”
For more information on how PME’s miniDOT logger can assist you in your next research project, reach out to us today.

